Blog Archives
Day 67: Pirates of the Caribbean Visit an AP Stats Classroom
Today, as we are finishing up our study of Combining Random Variables, I decided to use an activity I found on Chuck Bakers website about Pirate Liar Dice. We first watched a clip from the Pirates of the Caribbean where the pirates are playing Pirate’s Dice, a game in which each player has 5 dice and a cup. Check out the clip:
Then my students talked about what happened during the game (some said they didn’t have a clue) but most were able to recall the progression of the bids: 4 fours, 4 fives, 5 fives, 8 fives, 12 fives. They still weren’t sure what was happening, so we then watch this “Liar’s Dice in 60 Second” to clarify the rules:
Finally, they played. I don’t have enough dice for each student to get 5, so we used our Nspires and the randint( command to simulate rolling 5 dice. Then the bidding became. They had fun for sure and there were some subtle probability ideas percolating.

Our debrief after the game included the following questions:
- What were some things you thought of as you made bids?
- How did you know how many dice were left in play?
- How did you keep track of what dice the other players may have had?
- How improbable did a bid have to be for you to challenge it?
- When was it easier to make a safe bid?
- When was it harder to make a safe bid?
One of our vice-principals (who taught AP Stats in a former life) happened to be walking by so he popped in and joined in the discussions. Fun times for all, and hopefully a memorable experience for my students.
Share this:

Day 65: Go Fish Gallery Walk
I decided over the week-end that my AP Stats students needed some more time practicing binomial probabilities in context. And I have these great primary school magnetic fishing poles (you know the kind at the kindergarten carnivals?!). Time for Go Fish! but not the card game.
I collected a variety of binomial practice problems, cut them out, put metal clips on them and put them in a big bowl…my fish in a pond. Short “bang for the buck” experience as my statisticians “fished” for their problem, but they liked it anyways! They they had 20 minutes as a group to organized, solve and present their solutions in a poster form. Gave them some guidelines around that should be in their poster (used my acrylic stand-up frames…you can see in the photos)


Once time was up, the groups posted their solutions on my handy-dandy clothespins and did a gallery walk. They were each given 2 post-it notes. They were to put one praise and one suggestion for improvement on their sticky for two different posters. They also checked their peers’ work. I was really happy to see things like: “define the variable” “these are just numbers, what do they mean?” and “careful of your notation…you need P(x>2) not just the work”


Pretty good conversations. Still not sure some of my students are comfortable with the mechanics of the binomial process. Have to use an opener question to test that tomorrow.
Share this:

Day 56: Time to Review Probability!
We are getting ready to test the probability chapter in AP Statistics and it’s time to review. It’s time to use Review Stations again (used to review the summer work this fall). For each review station, I used my acrylic stand-up frames (I purchased last year at the Dollar Store), a laminated set of problems, an envelop with answers (for group self-checking) and an extra calculator. At some stations, I also included a laminated first semester formula sheet. I found problems that reflect common student mistakes or misconceptions as well as a smattering of AP exam questions.
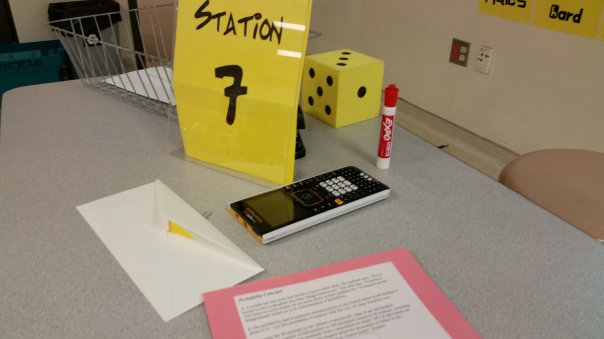
I used to put the stations at each group, but with my bigger science room I am using the counters and space to get my kiddos up and moving. So super quick to set up and take down between classes!

What kinds of activities to you use for reviewing that is student-centered and self checking? I’d love to hear about other ideas!
Update 12/4: These review stations (along with some of the other activities we did during the chapter) sure resulted in one of the best performances on the probability chapter ever! Bravo!!
Share this:

Day 55: Gamifying Probability Review
Ok, maybe not “gamify” in the sense that I created a new game, but we did do a competition with multiple choice questions. It seems students get mixed up a lot when reading probability multiple choice questions, so some practice before next week’s test is in order. Besides, it’s just before the 4-day Thanksgiving break, so I wanted to be sure my kiddos were actively engaged in good mathematical discussions.
I had 8 sets of 5 MC questions, duplicated twice on different colored paper and put into page protectors.
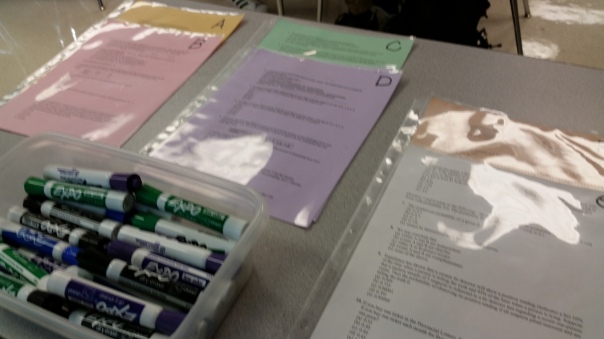
Then each group got one set with whiteboard markers and they got to work determining answers.
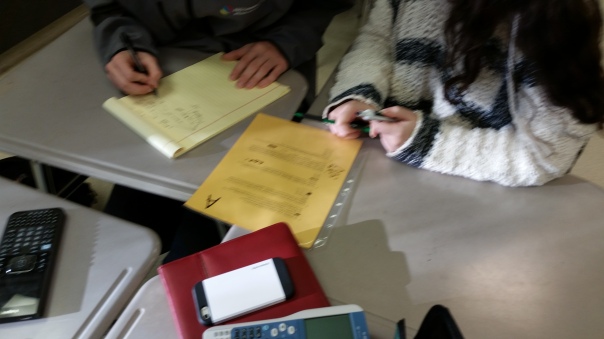
When they thought they had the correct answers, they came up to me and I checked them. If they were correct, they got 2 points. If not, then the first time through I only told them how many were incorrect. If they returned and they had corrected their mistake(s) then they got one point. If they still had things wrong, I would tell them the number and then they had to fix it, but would not earn any points. Once the group had correctly answered the 5 questions, they then picked up another set and repeated.
Share this:

Day 53: Reversing the Condition
Reversing the condition in probability can be a challenging concept for students in AP Stats. An example of a situation where reversing the condition is necessary is:
Athletes and Drug Testing Over 10,000 athletes competed in the 2008 Olympic Games in Beijing. The International Olympic Committee wanted to ensure that the competition was as fair as possible. So the committee administered more than 5000 drug tests to athletes. All medal winners were tested, as well as other randomly selected competitors. Suppose that 2% of athletes had actually taken (banned) drugs. No drug test is perfect. Sometimes the test says that an athlete took drugs, but the athlete actually didn’t. We call this a false positive result. Other times, the drug test says an athlete is “clean,” but the athlete actually took drugs. This is called a false negative result. Suppose that the testing procedure used at the Olympics has a false positive rate of 1% and a false negative rate of 0.5%. What’s the probability that an athlete who tests positive actually took drugs?
I have tried many different ways of helping students including introducing Bayes Theorem as a way to help students navigate these kinds of problems. I think the underlying issue is that my students come into class thinking they understand conditional probability when in fact they really don’t (Type I error?). One wonderful activity is Abby’s Kennels from the NCTM’s Navigating through Probability in Grades 9-12. This activity gives students a concrete experience with what a conditional probability really means. I regularly use this activity with my precalculus class if we study probability. In fact, many of my AP Stats students were in my precalc class when we studied probability and did the Abby’s Kennel activity. They still had a strong intuitive sense of what a conditional probability is – yay!!
It can be daunting for students to wade through verbiage like that above, let alone organize the information in an understandable way. I have found that giving my students the “anatomy of a tree diagram” has really helped! In particular, helping them see how to find the probability of the second event when they don’t have explicit information about it. Here is an example of the diagram I draw with them:

I have also re-created the “anatomy of a two-way table” although I personally don’t find tables as easy to set up when given conditional probabilities. This year’s students are more ready to create a tree diagram. From it, we can develop the reversed condition.
Share this:

Day 51: Human Venn Diagrams
Decided today that I wanted to get the kids up and moving a little in AP Stats. We are working on probability right now, and wanted to help make the connection between Venn diagrams and two-way tables in a personal way. I have two big balls of thick colorful yarn, magenta and baby blue. Cut out two long pieces and tied into circles. Also used painter’s tape to make a gianormous two-way table on my classroom floor. As my students walked into the class, they were already curious about what we were doing today…yay, instant engagement.

I had two sentence cards made up with MALE and PETS. Simple, but hoped there would be some overlap and some students that didn’t fit either. I put the two cards on the floor and they created the Venn diagram. I then asked what each group represented. Pretty simple. Then I asked them to rearrange themselves onto the two-way table…using the same cards as the table labels. Again asked what each region meant as well the complement of various descriptors. Then we did the whole activity again, but they determined the two descriptors. Very interesting and organic discussion about what works for descriptors and what needs to be thought through; for instance, ACT vs SAT for one descriptor or for both, or number of siblings, etc. We then did notes and they instantly were able to make the connections.


One thing I would change is perhaps ask a few probability questions based on the Venn diagram or two-way table, including “and” “or” and “given that” verbiage. Overall a very successful and minimal prep activity. It’s a keeper for me!
Share this:

Day 156: Probability Boot Camp
Every year it seems my students need additional practice with probability. I was Twitter-lurking again this week and came across Bob Lochel‘s response to a post asking about how people are prepping their kids. Just as David Griswold shared, I had searched for this gem and never did find it. Thanks Bob for sharing!

The questions in this review are thoughtfully put together, mixing in different key concepts and processes for probability. As a class, we talked through the first question together. Then I had the students work on the second question, and did a Navigator quickpoll with the intent to talk about the different answers. I was pleasantly surprised with how many answered correctly (although they didn’t follow directions for sig-figs). But we also were able to analyze the errors: gave the z-score, didn’t subtract from 1…and we followed that up with what might have happened).

As we continued, their success rate improved as is evidenced in this quickpoll results.
I particularly like these two questions as they ask students to put together multiple ideas and solve the problem using a multi-step process…so AP-like!
I really do like to use the quickpoll function of the Navigator to encourage mistake-analysis and engagement. What do you do to help students analyze mistakes?
Share this:

Day 140: Matrix Applications
How can one use matrices in real life….let me count the ways!! On Tuesday we explored how matrices can be used to change the contrast of photos, determine ranking of candidates in an election and count paths between objects.


Yesterday we delve into counting paths and raising matrices to powers based on a lesson I found at Engage NY: NYS Common Core Mathematics Curriculum.

Today we looked at Markov chains and transition matrices. Lots of oooo’s and ahhhh’s. Love it when the math’s coolness shines through to the kids!

Share this:

Day 77: Casino Lab 2014
Today we started the “famous” Casino Lab that gets done in so many AP Stats classes. This is my first time through and I’m was a little tentative about the whole gambling thing in my class, but my hope is that my students come away with the idea that gambling is risky and the long run results are rarely favorable to the player.

In our school we have an open-door policy which means we can have other staff “pop” into our classes at any time. This is such a good thing because it has built trust among staff about what goes on in other classes and gives us a chance to see what fabulous things our colleagues are doing.


Well today I happened to have four visitors including my principal and the superintendent. I think it went well in all respects and the kids were able to talk statistically about what they were doing and why they were doing the lab. YAY! Also had a student tell me that it was really interesting and so real world. They appreciated that. Tomorrow, more stations to run through.


Share this:

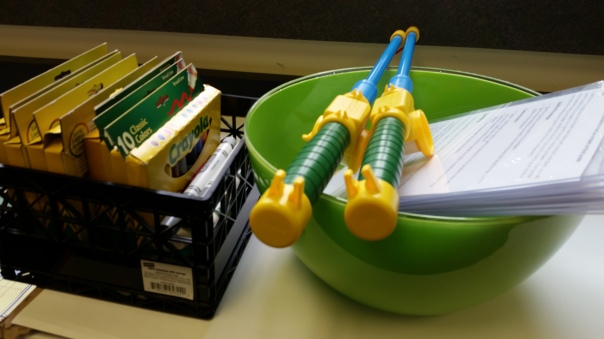
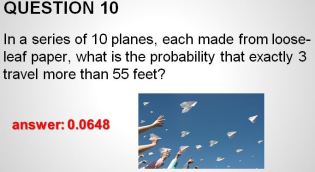
Day 70: Go Fish Binomials
Needed a catch for practicing binomial probabilities in AP Stats. This summer I saw these fishing rods for children aged 1-3…perfect for the high school!

So I put together 10 problems, cut them apart, folded and put a paperclip on each one. That way the magnet on the “fishing rod” would pick up problems from the “pool.” Dorky, but the boys at least had some fun.

The problems were great and the kids were focused and building confidence in their ability to approach and do problems about probability. Here’s an example (with answers :)):
It has been determined that 5% of drivers checked at a road stop show traces of alcohol and 10% of drivers checked do not wear seat belts. In addition, it has been observed that the two infractions are independent from one another. If an officer stops five drivers at random:
a. Calculate the probability that at least one of the drivers checked has committed at least one of the two offenses. 0.5431
b. Calculate the probability that exactly three of the drivers have committed at least one of the two offenses. 0.3344
How do you create engaging practice opportunities?

