Blog Archives
Day 99: Applying Technical Writing
Today we begin confidence interval for means in earnest in AP statistics. Yesterday after the activity, the students explored what a t-distribution was via this Geogebra document and looked at how to determine a critical t* value from a table as well as from the Nspire. (sidenote: although we do find values using tables occasionally, I emphasize using their calculator to find these values as well as the area probabilities…its all about saving time on the AP exam, so training them now will help them to be comfortable using their calculator later during all of the inference procedures).
Today, we did our first write-up of a t-interval for means, emphasizing the conditions that need to be met. I am so glad that I “over-emphasize” these when they are learning about sampling distributions. Of course, we write one up together so they understand what needs to be shown and stated in the inference procedure.

As I’m writing this post, an idea popped into my head: a procedure wall! Just like the word walls used in algebra and geometry classes but with the proper name of the procedure. I’ll have a way to cover when they are taking an assessment. I can use sentence strips, and maybe color-code for proportions vs. means vs. others. Will have to ruminate on this a little more to flesh out the details…look for a future post on this!
Share this:

Day 98: More CI Writing
So, yesterday, most of the groups got the statements sorted. Today they will create a poster of the incorrect statements and write underneath each one what the error is. I found a great explanation by Bock about the types of interpretation errors with examples and explanations. My students used this document to help guide them. And they eventually were able to identify correct and incorrect statments, but also were able to articulate what made interpretations incorrect. YAY!


Share this:

Day 97: Technical Writing Practice
I’m sure you’ve never experienced this: things seemed to be going well until you assess, and then you find out you were in dream land! That happened to me after the last mini-quiz I gave my AP statistics students on confidence intervals. Although I gave them the sentence stems in their notes followed by whole class writing practice as well as individual practice, the assessment showed that they really didn’t know what they were talking about…no real surprise!


So I spent last night putting together a card sort on confidence interval statements around the Pink Sweetheart conversation heart activity. I created 16 statements, some written correctly but using different wording, some incorrect, some based on the statements the kids wrote on their assessments. They first had to read through the statements as a group. Then they sorted into correct and incorrect statments. Thats as far as we got today. More tomorrow…..
Share this:

Day 83: Assessment using Google Forms
As I mentioned yesterday, I am becoming a big fan of Google Forms for an easy and flexible medium for assessing student work. Needless to say, the possibilities for building in student voice in the classroom are so broad.
Today, I began to read through and grade my AP Statistics students’ Bias Projects. The posters were hung in the classroom, as you saw yesterday. I took my high stool and my iPad and worked my way around the room. The Google Form I set up made it easy to assess and record. I used the “4” or top rating descriptors under each category to help me focus on the key aspects of the category. For instance, one category is Data Collection. The descriptor included
- Method of data collection is clearly described,
- Includes appropriate randomization,
- Describes efforts to reduce bias, variability, confounding,
- Quantity of data collected is appropriate.
The descriptors helped me gauge the quality of my students’ product and the Google Form drop-down made it a breeze to quickly grade.

I spent about 7 minutes per poster reading and evaluating the quality of the work.


Once I finished assessing the final products, I posted them outside my room to share with the school. As students and teachers walk by, I hear lots of interesting comments…I sure hope it translates into increased enrollment next year.


Share this:

Day 82: Response Bias Project
I just want to thank Josh Wilkerson once again for helping me create meaningful experiences for my AP Statistics students. As I mentioned earlier this year, I am hoping to replicate his Community Service Learning Project as the end of year experience for my students.
One suggestion Josh gave was to give two smaller projects during first semester to see how students work together. I have found that they also give opportunities for the students to revisit previous concepts in a real world setting. In first quarter, my students completed an Infographics Project. In second quarter, I had them complete the Response Bias Project he suggested. And I love the results!!
The projects were due today. As part of the evaluation process, students needed to complete a peer review of 4 other projects. I used GoogleForms for students to enter their evaluations as well as include comments. They had about 8 minutes to read through the poster and evaluate it. I thought they’d need 10 minutes, but they didn’t


What I like about the Google Form is it is easy to make accessible to my students, by using our school login I get an automatic signature and the students can keep resubmitting the form. In addition, the results end up in an Excel spreadsheet so I can then add up the totals, sort by student being evaluated as well as those who did the evaluating.


Student earned points from the average of their peers’ evaluations as well as points for thoughtful and meaningful evaluations of their peers. I now hope to merge the comments into a personalized Word document so each student can get their peers’ feedback anonymously. Here are a few of the peer comments:
- Originally I liked the idea of flaps but as soon as I had to reach on my tippy toes to hold the flap up I grew tired of it. Then I took the poster down from the wall and I liked the design again.
The plentiful analysis in the conclusions is good and clear. I’m surprised 20 males said they didn’t support feminism, especially since we’re talking about XXHS students! - I like how you chose a topic extremely relevant to all of us. You did a good job explaining the difference in the questions and why that would elicit different responses. Don’t forget your table! Do you think underclassmen would give different results? I might interview them too in order to remove bias.
- I thought the experiment was very well thought out and thorough. You lovely duo did a great job articulating your points. Maybe in the future you should experiment with whether putting one of the names first affects the results? I might also put less text and more visual stuff on the poster. Great job though
- I feel like the questions are a little vague, as they could present a large amount of bias. Some students might not like the teachers, even though they are learning a lot and they are satisfied with the learning, prompting more “no” answers than should be present. However, I love the organization of this poster, it is very neat.
- I like how you captured an interesting concept (extra information bias) very simply. But, given that your population is American Women, I think it is statistically incorrect that you only found samples from XXXXX’s Facebook contacts who do not represent all American women. A better population would have been Teenage girls in XXXXXXXXX.
I love how my students used the statistical vocabulary with ease and relatively correctly! This project is definitely a keeper.
Share this:

Day 81: Why Prep an Assessment Debrief?
Today my AP Stats students had the final unit test of this semester. It was on Sampling Distributions which can be fraught with conceptual as well as mechanical errors. So how do I address them? How do I remember them? How do I learn from them? How can I use them to inform my practice next year?

One thing I do is an Assessment Debrief on a lined Post-It note. As I grade and notice consistent errors or misconceptions, I’ll document right then what I’m thinking. I used to think about these things, but forget the gist by the time I was handing back assessments. This helps me organize to communicate better with my kiddos.

But the even better thing is that I stick it on the key and when I begin planning for the chapter the next year, I have detailed notes of errors as well as the big conceptual misunderstanding. Then I can plan ahead about how to draw out these misconceptions or process errors early in the chapter. YAY!!
Share this:

Day 76: CLT not BLT!
Today we revisited the Rossman/Chance Reeses Pieces Simulation to look at once again the sampling distribution of proportions. Using this simulation, we reviewed notation, which is so challenging for students when they first see it.

We then used the Rice Virtual Labs to set the groundwork for the assumptions and conditions of a sampling distribution of means and the two situations for knowing it is approximately Normal: Normal population vs. unknown population.

My AP Stats students, using their iPads, explored what happens when the population is Normal, when it is not, and whether they could come up with a population that would not yield an approximately Normal sampling distribution. Once again, we reviewed the notation and also determined the formula for the standard deviation…they actually came up with the rule!!


Love having technology at my students’ finger tips! And thanks to Rossman/Chance for updating the applets to work with iPads…so much better when students do their own exploring rather than watching me do it at the front.
Share this:

Day 75: SINning in Stats
Today we begin the journey to Inferential Statistics in my AP Statistics class. And I use the development of the sampling distribution of a statistic as a means to set up good habits as well as develop the conceptual understanding of why we need to check conditions for the elements of the sampling distribution: Center, Spread, and Shape.

I found that students really struggled with all of the apparently different conditions for the various inference methods we study in second semester. I really wanted to streamline the process of checking the conditions. After looking at and comparing the various assumptions and conditions, I realized that the two sampling distributions used in the inference procedures about proportions or means boiled down to two things: a random element in the data collection method (simple random sample or randomized experiment), and sample size where one needs both a large enough and a small enough sample to determine the standard deviation and shape. In addition, I needed to help my students understand the difference between assumptions and conditions.
Here is a summary of what I found:
Assumptions:
Independence Assumption: The sampled values must be independent of each other
The Sample Size Assumption: The sample size, n, must be large enough
Assumptions are hard—often impossible—to check. Still, we need to check whether the assumptions are reasonable by checking conditions that provide information about the assumptions. The corresponding conditions to check before using the Normal to model the distribution of sample proportions or means are the Randomization Condition, 10% Condition and the Success-Failure Condition/Large Enough Sample Size Condition.
Conditions you can check:
Randomization Condition: The data must be representative of the population. (That is, it must come from a randomized experiment, or from a simple random sample of the population; the sampling method must be unbiased.)
10% Condition: The sample size, n, must be no larger than 10% of the population.
Success/Failure Condition: The sample size must be large enough so that we can expect at least 10 “successes” and 10 “failures”. That is, np > 10 and nq > 10 OR Large Enough Sample Condition: If the population is unimodal and symmetric, any size sample is sufficient. Otherwise, a larger sample is needed.
I also wanted it have some kind of cognitive framework to fit these ideas. How could I combine the ideas into chunks that include the essence of the assumptions and conditions? Well, Random made its own sense, but Independence and the 10% condition were intertwined, and the approximately Normal shape was tied to having a large enough size sample via success vs fails or simply a larger sample was better.
Acronyms are great memory devices, especially when first learning about something new and complex. The acronym is a simple organizational tool that reminds the user of the complex ideas. My next thought was what kind of acronym could I come up with for these? RIN (for random, independence and normal)..but there was no real hook or interesting connection with RIN. How about SIN where S stood for random Sample…but that was somewhat suspect because not all inference is about sampling, so I did stretch it a little to say SRS or random assignment (they both sound essy). And I use the catchy phrase, “It is a SIN to not check the conditions.” And I have found that my kiddos don’t forget to check them….phewww!
Here is an example of how we talk through these ever important assumptions and conditions. As the year progresses, we fine-tune and focus in on the important distinctions, but the acronym SIN and these three words give us a simple framework to talk about the distinctions. To set the groundwork for next semester, I have students recognize the assumptions/conditions AND what the condition guarantees.

Share this:

Day 67: Pirates of the Caribbean Visit an AP Stats Classroom
Today, as we are finishing up our study of Combining Random Variables, I decided to use an activity I found on Chuck Bakers website about Pirate Liar Dice. We first watched a clip from the Pirates of the Caribbean where the pirates are playing Pirate’s Dice, a game in which each player has 5 dice and a cup. Check out the clip:
Then my students talked about what happened during the game (some said they didn’t have a clue) but most were able to recall the progression of the bids: 4 fours, 4 fives, 5 fives, 8 fives, 12 fives. They still weren’t sure what was happening, so we then watch this “Liar’s Dice in 60 Second” to clarify the rules:
Finally, they played. I don’t have enough dice for each student to get 5, so we used our Nspires and the randint( command to simulate rolling 5 dice. Then the bidding became. They had fun for sure and there were some subtle probability ideas percolating.

Our debrief after the game included the following questions:
- What were some things you thought of as you made bids?
- How did you know how many dice were left in play?
- How did you keep track of what dice the other players may have had?
- How improbable did a bid have to be for you to challenge it?
- When was it easier to make a safe bid?
- When was it harder to make a safe bid?
One of our vice-principals (who taught AP Stats in a former life) happened to be walking by so he popped in and joined in the discussions. Fun times for all, and hopefully a memorable experience for my students.
Share this:

Day 65: Go Fish Gallery Walk
I decided over the week-end that my AP Stats students needed some more time practicing binomial probabilities in context. And I have these great primary school magnetic fishing poles (you know the kind at the kindergarten carnivals?!). Time for Go Fish! but not the card game.
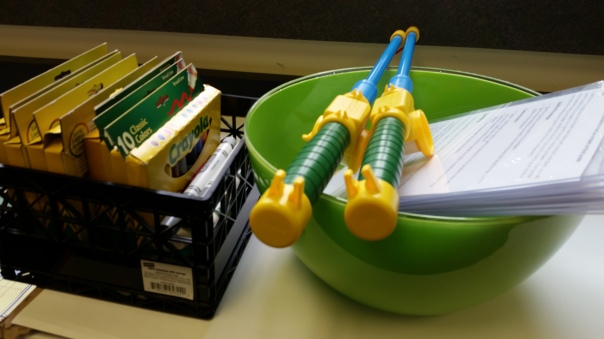
I collected a variety of binomial practice problems, cut them out, put metal clips on them and put them in a big bowl…my fish in a pond. Short “bang for the buck” experience as my statisticians “fished” for their problem, but they liked it anyways! They they had 20 minutes as a group to organized, solve and present their solutions in a poster form. Gave them some guidelines around that should be in their poster (used my acrylic stand-up frames…you can see in the photos)


Once time was up, the groups posted their solutions on my handy-dandy clothespins and did a gallery walk. They were each given 2 post-it notes. They were to put one praise and one suggestion for improvement on their sticky for two different posters. They also checked their peers’ work. I was really happy to see things like: “define the variable” “these are just numbers, what do they mean?” and “careful of your notation…you need P(x>2) not just the work”


Pretty good conversations. Still not sure some of my students are comfortable with the mechanics of the binomial process. Have to use an opener question to test that tomorrow.

